Tuesday, December 7, 2010

Get the server "STATUS" when server is offline..!! -- PART - I

Hello All,

While I was away for some of the photography and some techno-graphy, I did some of the nice moves on the Photography side and Technology side..

You can catch my photography on my http://magical-shots.blogspot.com and here for Technology I work on..!!

These days I was working some of the SNMP features, many of you may know that we need SNMP to monitor the WebLogic Servers in various aspects as to monitor the WebLogic Server MBeans

Here we setup SNMP Traps for UNKNOWN Status of the server.

This scope is divided into 2 scopes of SNMP Functions
1. Domain Scoped SNMP Agent
2. Server Scoped SNMP Agent

In this Part we will work on Domain Scoped SNMP Agent.

In WebLogic Server Version 8.1 This feature of UNKNOWN Server Traps Generation was possible, but when new portal versions (9.2, 10.x and 11g) are introduced this feature faded to appear, and in new versions server doesn't generate any traps for UNKNOWN status of the server.

We believe that, whenever server enters into UNKNOWN Status, it will not be able to send any messages to Admin Server about its status as the status of the server will not be known to the Admin Server, and after all Kill -9 and a abrupt power failure of the server or many other circumstances result into pushing server into UNKNOWN Status.

For this feature, we have to apply the patch developed by Oracle (Patch ID : UE4C)

And then follow the following Steps to Setup a SNMP Traps for UNKNOWN Status of the Server.

I am using WebLogic Server Version 10.3.0.0

Step 1. Go to Servers, Check the status as Shutdown after starting the Admin Server


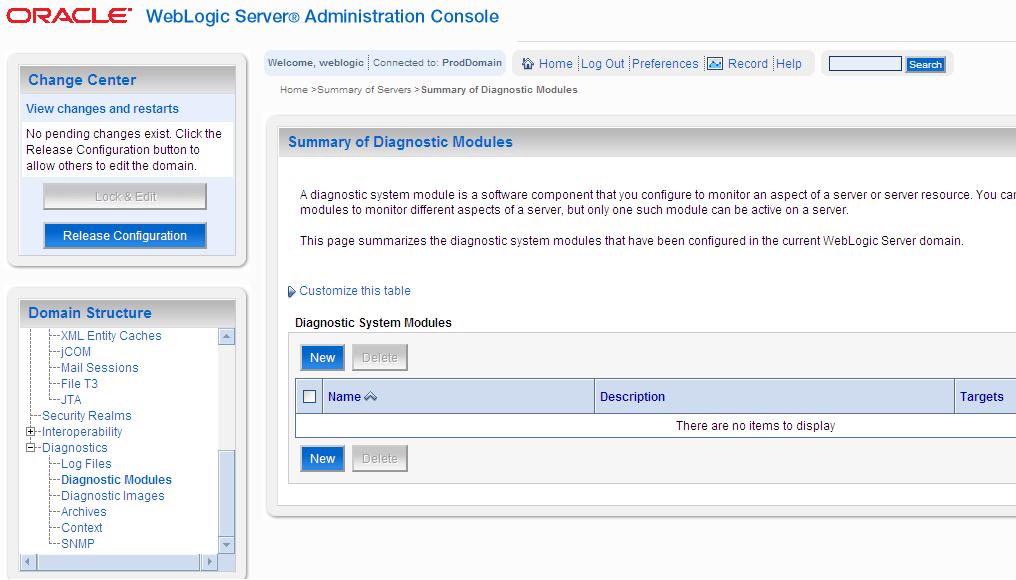
Step 2. Click on Diagnostics --> SNMP


Step 3. You can see a pre-existing domain scoped SNMP Agent in disabled state. Click on that and Enable the SNMP Agent by Click on the Check Box.


Step 4. Save the Configuration.


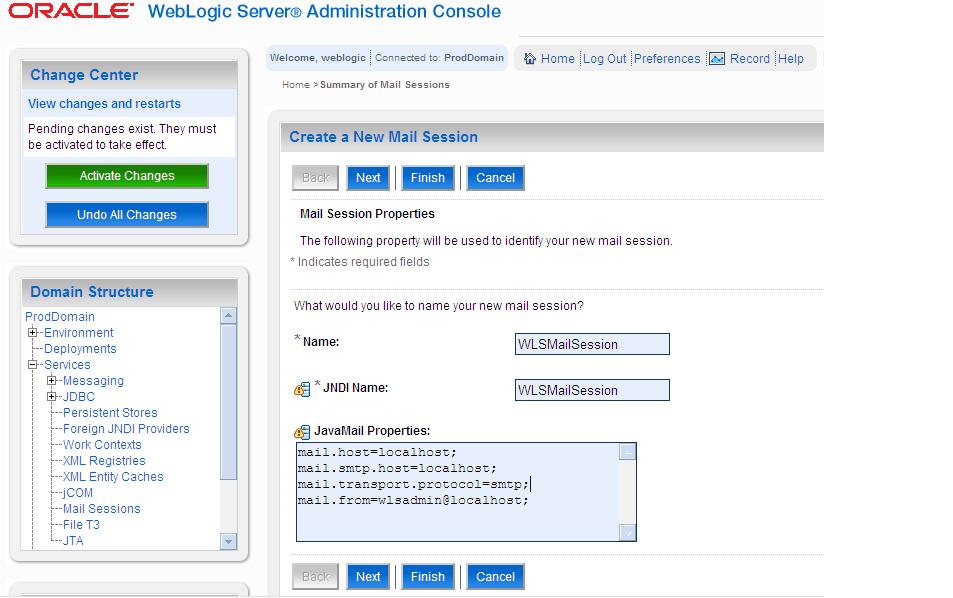
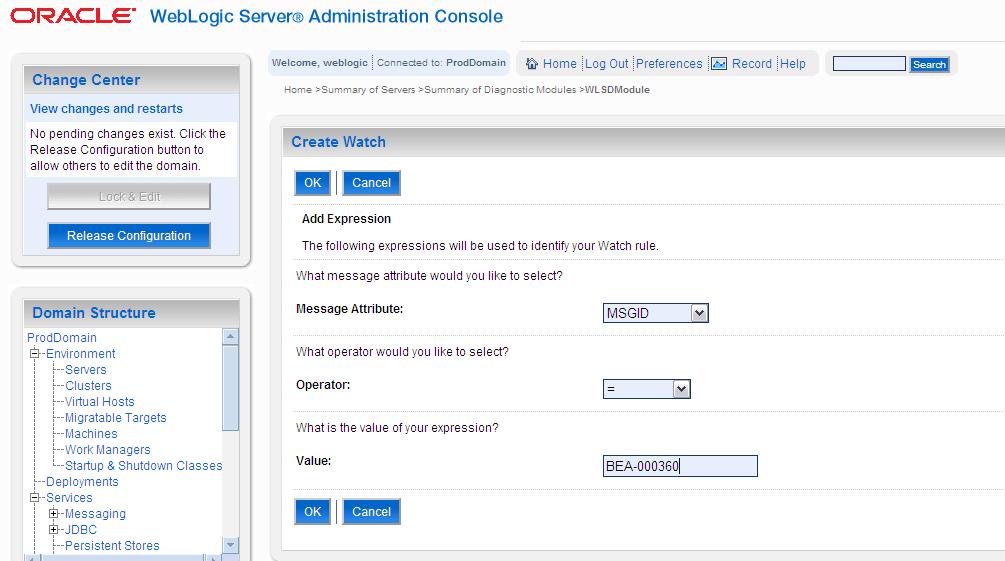
Step 5 . Configure the String Monitors.

Please Note : Don't Target any of the Servers.


Step 6. Save the configuration.

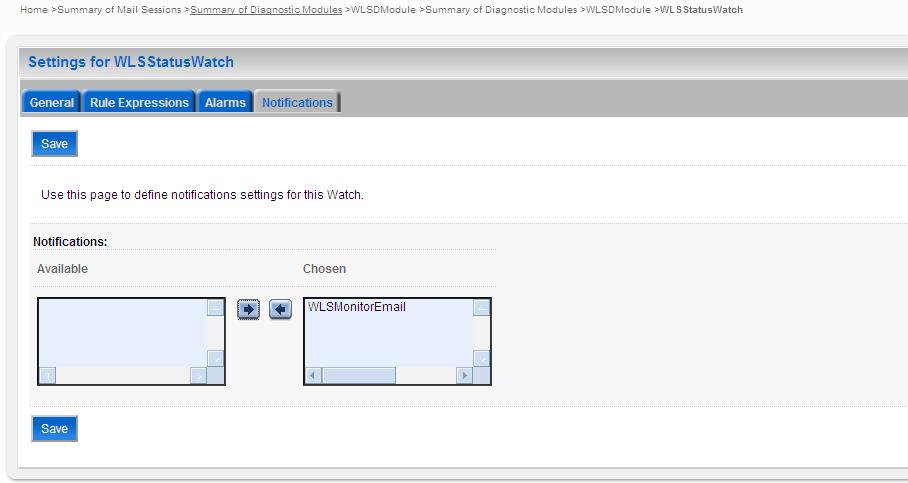
Step 7. Create Trap Destination as in below Configurations.


 Step 8. Save and Activate the Changes.

Step 9. Start the SNMP Trap Monitor as in below command after setting the WebLogic Environment.

"${JAVA_HOME}/bin/java" weblogic.diagnostics.snmp.cmdline.Manager SnmpTrapMonitor -p 1121
Step 10. Now try to start one of the Managed Servers and watch the traps from the server.

Here are SNMP traps for various states for WebLogic Servers you will see..

For Successful Server startup :

--- Snmp Trap Received ---
    Version        : v1
    Source         : UdpEntity:10.177.57.149:1101
    Community      : public
    Enterprise     : enterprises.140.625
    TrapOID        : enterprises.140.625.0.65
    RawTrapOID     : 1.3.6.1.4.1.140.625.0.65
    Trap Objects   : {
   { enterprises.140.625.100.5=Tue Dec 07 20:20:00 GMT+05:30 2010 }
   { enterprises.140.625.100.10=Managed-1 }
}
    Raw VarBinds   : {
   { enterprises.140.625.100.5=Tue Dec 07 20:20:00 GMT+05:30 2010 }
   { enterprises.140.625.100.10=Managed-1 }
}

For Successfull Server Shutdown :
--- Snmp Trap Received ---
    Version        : v1
    Source         : UdpEntity:10.177.57.149:1101
    Community      : public
    Enterprise     : enterprises.140.625
    TrapOID        : enterprises.140.625.0.70
    RawTrapOID     : 1.3.6.1.4.1.140.625.0.70
    Trap Objects   : {
   { enterprises.140.625.100.5=Tue Dec 07 20:18:33 GMT+05:30 2010 }
   { enterprises.140.625.100.10=Managed-1 }
}
    Raw VarBinds   : {
   { enterprises.140.625.100.5=Tue Dec 07 20:18:33 GMT+05:30 2010 }
   { enterprises.140.625.100.10=Managed-1 }
}
For Server Kill or Power Failure kind of instances..!! - Implemeneted Kill -30 on the WebLogic Java process as it assumes to be power failure.

--- Snmp Trap Received ---
    Version        : v1
    Source         : UdpEntity:10.177.57.149:1101
    Community      : public
    Enterprise     : enterprises.140.625
    TrapOID        : enterprises.140.625.0.75
    RawTrapOID     : 1.3.6.1.4.1.140.625.0.75
    Trap Objects   : {
   { enterprises.140.625.100.5=Tue Dec 07 20:22:40 GMT+05:30 2010 }
   { enterprises.140.625.100.10=AdminServer }
   { enterprises.140.625.100.55=jmx.monitor.string.matches }
   { enterprises.140.625.100.60=UNKNOWN }
   { enterprises.140.625.100.65=UNKNOWN }
   { enterprises.140.625.100.70=com.bea:Name=Managed-1,Type=ServerLifeCycleRuntime }
   { enterprises.140.625.100.75=ServerLifeCycleRuntime }
   { enterprises.140.625.100.80=State }
}
    Raw VarBinds   : {
   { enterprises.140.625.100.5=Tue Dec 07 20:22:40 GMT+05:30 2010 }
   { enterprises.140.625.100.10=AdminServer }
   { enterprises.140.625.100.55=jmx.monitor.string.matches }
   { enterprises.140.625.100.60=UNKNOWN }
   { enterprises.140.625.100.65=UNKNOWN }
   { enterprises.140.625.100.70=com.bea:Name=Managed-1,Type=ServerLifeCycleRuntime }
   { enterprises.140.625.100.75=ServerLifeCycleRuntime }
   { enterprises.140.625.100.80=State }
}

Please let me know if you are facing any difficulty in setting SNMP.

Thanks,

Your comments are much helpful.

Shailesh Dyade


Thursday, October 21, 2010

WLST Simplified..!!

Hello All,

After a long gap I am posting in this blog again, as I was stuck with my Photography interests and the result is my new blog : http://magical-shots.blogspot.com, please visit once and share some views if you really like it..!!

In last few days I was busy with a nice tool/application which is developed by Collabnet for use with WebLogic Server various versions called WLNav (WebLogic Navigator), its very nice tool if you really want to get rid of WLST's Black Screen and Commands, You can find this tool @ http://wlnav.open.collab.net/

Its basically built on WLST and accesses all MBean Information of WebLogic server, so give it a try, download it from the above link and Deploy it on desired server and access the application providing username and password for WebLogic server for the application interface, and then you will see how good the application is designed..

Please Note : You Should know basics of WLST to actually understand this, if you need any understanding about WLST, please let me know, I will be really happy to post WLST Topics on demand.!!


Sample Picture of this Application :


Please share comments if you like..!!

Thanks
Shailesh Dyade

Thursday, September 2, 2010

Script to find the PID of the Process which ps command cannot list.

Sometime we may need some command or code or logic to find the process id of the process when every other command fails to do that, like if you use ps -ef | grep then you will fail to see the process, but the same time if the process was using some port for example 8888, then after killing the process by kill -9 or shutting down the process by using specific shutdown scripts, the port will be still active at that time you will fail to bind this port with new process of same server/instance.

for that we can use following shell script to find out the socket process which are still active on the ports, it will list by process id.

#!/bin/bash


# is the port we are looking for

if [ $# -lt 1 ]
then


echo "Please provide a port number parameter for this script"


echo "e.g. %content 8888?"
exit


fi

echo "Greping for your port, please be patient (CTRL+C breaks) . "

for i in `ls /proc`
do


pfiles $i
grep AF_INET
grep $1


if [ $? -eq 0 ]


then


echo Is owned by pid $i


echo ""


fi

done

Any comments ?? / Suggestions ??
 
Thanks
Shailesh

$ Symbol in UNIX - Dollar Symbol in Unix

Many of us still wonder about what $ symbol stands for, some of us know that $ stands for shell prompt for user and # stands for shell prompt for root in many Unix systems, but we have different meanings for different types of symbols associated with $ as below.

$ Symbol is used in UNIX as variable in sometimes and sometimes its used to define some variables.

In first case we have many variables associated with $ as below.

$? = Stores last commands exit Status
$$ = Stores PID of the current process.
S# = Stores number of passed parameters
$*/$@ = Lists all the passed parameters
$0 = Stores the Program or Script name
$1 - $9 = Stores the first 9 Parameters passed to the script.

For Second case :

We have some variables set for environment like

$PATH
$SHELL
$USER ... etc.


and we can define the values using $  Symbol once

bash-3.00$ x=1

bash-3.00$ echo $x
1
bash-3.00$

Thanks
Shailesh Dyade

Tuesday, July 27, 2010

Link for LDAP

Hello All,

I have found this link, which provides most comprehensive books and documentation for LDAP.

Please go through this if you need any information on LDAP.

Thanks
Shailesh Dyade

Sunday, July 25, 2010

Managing WebLogic JMX Through JConsole


JConsole is part of JDK, it can be found in $JAVA_HOME/bin directory, and this utility can be used as JMX Console for Managing WebLogic Server, Where you can see the WebLogic Server configuration and invoke various MBean operations, it helps to view and edit the MBean configuration and invoke various JMX Operations on the serverRuntime, serverConnfig and domainRuntime

Here in this post we will see how to setup JConsole for WebLogic Server 10g.

As JConsole is free and distributed with JDK, there is no need of downloading it seperately

We will follow simple steps to setup the JConsole for WebLogic Server
JConsole works in two modes :
  1. Local Process Mode -> Checks for Local Java Process to Manage them through console
  2. Remote Mode ->We Can provide JMX URL to Manage the Remote Java Process
We Normally Use Remote mode as we need to connect the JConsole to MBean Server of WebLogic Application Server

Step 1. Start WebLogic Admin Server

Fig1. Admin Server ProdDomain Started


Step  2. Login to Admin Console and check the domain configuration
Fig 2. Check Domain's Advanced Configuration as The MBean Servers are enabled or not
Step 3. Check for the Parameters "Compatibility MBean Server Enabled" and "Management EJB Enabled" Status ( They Should be Enabled - By Default They are enabled)

Fig 3 : MBean Servers Enabled (Check box checked by default)
 Step 4. Check The Configuration at Admin Server Side in Ports Tab - > IIOP

Fig 4. IIOP Should be enabled in Admin Server IIOP Port Configuration
Fig 5. Provide some user name and password (preferable weblogic/weblogic), as Anonymous users are not allowed to connect to the JMX MBean Server (Advanced Options in IIOP)

Step 5. Save and Activate Changes - This Needs Restart of the Admin Server.
Fig 6. Change in the IIOP Credentials require restart of the Server Affected


Notice that the logs at the startWebLogic.cmd command window shows as below

The non-dynamic attribute DefaultIIOPPasswordEncrypted on weblogic.management.configuration.ServerMBeanImpl@453b029e([ProdDomain]/Servers[AdminServer]) has been changed. This may require redeploying or rebooting configured entities
change has been made which affects the server AdminServer. This server must berebooted in order to consume this change

Step 6. Restart the Admin Server
Fig 7. Stop the Admin Server (Ctrl+C)


Fig 8. Start the Admin Server (startWebLogic.cmd)


Step 7. Start JConsole - Execute following Steps and Verify the output

Microsoft Windows XP [Version 5.1.2600]
C) Copyright 1985-2001 Microsoft Corp.

C:\Documents and Settings\Administrator>cd \

C:\>echo %WL_HOME%
C:\bea\wlserver_10.3

C:\>echo %JAVA_HOME%
C:\Program Files\Java\jdk1.6.0_13
 

C:\>cd %WL_HOME%

C:\bea\wlserver_10.3>cd server

C:\bea\wlserver_10.3\server>cd bin

C:\bea\wlserver_10.3\server\bin>setWLSEnv.cmd

CLASSPATH=C:\bea\patch_wlw1030\profiles\default\sys_manifest_classpath\weblogic_patch.jar;C:\bea\patch_wls1030\profiles\default\sys_manifest_classpath\weblogic_p
atch.jar;C:\bea\patch_wlp1030\profiles\default\sys_manifest_classpath\weblogic_patch.jar;C:\bea\patch_cie670\profiles\default\sys_manifest_classpath\weblogic_pat
ch.jar;C:\bea\JROCKI~1\lib\tools.jar;C:\bea\WLSERV~1.3\server\lib\weblogic_sp.jar;C:\bea\WLSERV~1.3\server\lib\weblogic.jar;C:\bea\modules\features\weblogic.serv
er.modules_10.3.0.0.jar;C:\bea\WLSERV~1.3\server\lib\webservices.jar;C:\bea\modules\ORGAPA~1.5/lib/ant-all.jar;C:\bea\modules\NETSFA~1.0_1/lib/ant-contrib.jar;C:
\Program Files\Java\jdk1.6.0_13\bin;

PATH=C:\bea\patch_wlw1030\profiles\default\native;C:\bea\patch_wls1030\profiles\default\native;C:\bea\patch_wlp1030\profiles\default\native;C:\bea\patch_cie670\p
rofiles\default\native;C:\bea\WLSERV~1.3\server\native\win\32;C:\bea\WLSERV~1.3\server\bin;C:\bea\modules\ORGAPA~1.5\bin;C:\bea\JROCKI~1\jre\bin;C:\bea\JROCKI~1\
bin;C:\Program Files\PC Connectivity Solution\;C:\WINDOWS\system32;C:\WINDOWS;C:\WINDOWS\System32\Wbem;C:\Program Files\IBM\Infoprint Select;C:\Notes;C:\Program
Files\XLView;C:\lotus\compnent;C:\Utilities;C:\Program Files\Common Files\Lenovo;C:\program files\ibm\personal communications\;C:\Program Files\IBM\Trace Facilit
y\;C:\Program Files\Intel\WiFi\bin\;C:\Program Files\ThinkPad\ConnectUtilities;C:\Program Files\Common Files\GTK\2.0\bin;C:\Program Files\QuickTime Alternative\Q
TSystem;C:\Program Files\IBM\edge\lb\servers\lib;C:\PROGRA~1\IBM\edge\icu\lib;C:\PROGRA~1\IBM\edge\admin\platform\bin;C:\PROGRA~1\ibm\gsk7\\bin;C:\PROGRA~1\ibm\g
sk7\\lib;C:\PROGRA~1\IBM\edge\cp\Bin;C:\PROGRA~1\IBM\edge\cp\lib\plugins\pac;C:\Program Files\Java\jdk1.6.0_13\bin;;C:\bea\WLSERV~1.3\server\native\win\32\oci920
_8

Your environment has been set.
C:\bea\wlserver_10.3\server\bin>


C:\bea\wlserver_10.3\server\bin>cd %JAVA_HOME%


Step 8. Execute the following command to invoke "jconsole remote"

jconsole -J-Djava.class.path=%JAVA_HOME%\lib\jconsole.jar;%WL_HOME%\server\lib\wljmxclient.jar -J-Djmx.remote.protocol.provider.pkgs=weblogic.management.remote


Step 9. We will get to see the console as below.
Fig 9 . JConsole Login Screen
Step 10. Please provide Service JMX URL for Admin Server and Specify the MBean Tree to enter as below and their particular JConsole Space.


1. service:jmx:rmi:///jndi/iiop://localhost:7011/weblogic.management.mbeanservers.domainruntime


username/password = weblogic/weblogic
Fig 10. JConsole Domain Run Time Session
2. service:jmx:rmi:///jndi/iiop://localhost:7011/weblogic.management.mbeanservers.runtime
username/password = same as above
Fig 11. JConsole Server Run time Session


3. service:jmx:rmi:///jndi/iiop://localhost:7011/weblogic.management.mbeanservers.edit
username/password = same as above
Fig 12. JConsole Edit Session in Edit Tree.


This is it..!!

Please let me know if you have any feed back suggestion here.


Thanks for Visiting My Blog - Please Share your feed back and ideas.


Regards,
Shailesh Dyade

Saturday, July 24, 2010

Setting Up An Email Alert System To Monitor Server Status Using Diagnostics Module In WebLogic Application Server

We need our application deployed in WebLogic Server to be up all the time, we cannot take risk the application downtime, and we cannot risk our business, but to monitor the servers which hold live applications need monitoring for the application availability.

WebLogic Server allows the usage of external tools and utilities for monitoring of internal application and components by executing various types of operation on MBeans like set() and get(), there are many more tools, utilities are in the market to provide monitoring feature for WebLogic Server and its deployed applications
Here in this post we are going to work/discuss on a Unique feature of WebLogic Server Called WebLogic Diagnostics Framework, In that we are going to work on Diagnostics Modules, with this we can monitor JMX Beans and system statistics.

For Testing purpose we are carrying out the experiment Production Mode Enabled - ProdDomain

(Please Note : Right click and Open In New Window on the images to enlarge it)
Setup A Java Mail Session

Step 1. Create A Mail Session


Step 2. Specify the connection parameters for Java Mail
Step 3. Target it to Admin Server or Server you wanted to Monitor


Step 4. Verify Mail Session Information
Configuring Diagnostics Modules , Notifications and Watches

Diagnostics Modules
Step 5. In Left Hand Side Navigation Tree Select Diagnostic Modules to Add New Diagnostic Module Monitor WebLogic Server
Step 6. Enter Basic Information to Create WebLogic Server Diagnostic Module

Create Notifications and Watches
Step 7. Select Watches and Notification Tab and Select Severity and Log Watch Severity to Notice

Step 8. Scroll down on the same page to add new Watches and Notifications
Step 9. Create new Notification as shown above

Step 9. Set Up Email Preferences for the Notification and Finish the Configuration
Step 10. Create the Watch From Where you have created Notifications.
Step 11. Provide Watch Name and Watch Type as above and Keep Enable Watch Checked
Step 12. Configure What to Watch For the Server After Clicking on Adding Expression
Step 13. You Can Many Number of Watches to the Watch Database you Can see MSGID Updated in above Picture
Please Note : Here We Are setting up the watch and notification for RUNNING Status for the server as BEA-000360 is BEA Message Code for  Server RUNNING Status

Step 14. Do Not Set Any Alarms
Step 15. Assign the Notification Created for the Status of The WebLogic Server to the Watch Just Created
Step 16. Activate All the Pending Changes

Setup Mail Server For Receiving Mails From WebLogic

Download Apache Mail Server (JAMES) from this link or go to Download Page for latest releases

Unzip the downloaded zip file and follow the following steps

Step 1. Go to C:\James\james-2.3.2\bin directory


Step 2. Edit run.bat file if you are running it in Windows (For Unix you have run.sh file)


Step 3. Add line "set JAVA_HOME=C:\Program Files\Java\jdk1.6.0_13" ( Your JAVA_HOME Directory)


Step 4. Open Command Prompt ( Start -> Run -> CMD -> Enter)


Step 5. Navigate to Path -> C:\James\james-2.3.2\bin


Step 6. Execute run.sh file from this path


You will see following O/P

C:\James\james-2.3.2\bin>run.bat
Using PHOENIX_HOME:   C:\James\james-2.3.2
Using PHOENIX_TMPDIR: C:\James\james-2.3.2\temp
Using JAVA_HOME:      C:\Program Files\Java\jdk1.6.0_13

Phoenix 4.2

James Mail Server 2.3.2
Remote Manager Service started plain:4555
POP3 Service started plain:110
SMTP Service started plain:25
NNTP Service started plain:119
FetchMail Disabled


Your Mail Server is Up Now, The Service is running at 4555 port number on localhost.


Step 7. Telnet to localhost with Port Number 4555


# Default User Name and Password for Mail Server is root/root

Step 8 . Create "WebLogic" User
JAMES Remote Administration Tool 2.3.2
Please enter your login and password
Login id:
root
Password:
root
Welcome root. HELP for a list of commands
HELP
Currently implemented commands:
help                                    display this help
listusers                               display existing accounts
countusers                              display the number of existing accounts
adduser [username] [password]           add a new user
verify [username]                       verify if specified user exist
deluser [username]                      delete existing user
setpassword [username] [password]       sets a user's password
setalias [user] [alias]                 locally forwards all email for 'user' to 'alias'
showalias [username]                    shows a user's current email alias
unsetalias [user]                       unsets an alias for 'user'
setforwarding [username] [emailaddress] forwards a user's email to another email address
showforwarding [username]               shows a user's current email forwarding
unsetforwarding [username]              removes a forward
user [repositoryname]                   change to another user repository
shutdown                                kills the current JVM (convenient when James is run as a daemon)
quit                                    close connection

adduser weblogic weblogic   (weblogic/weblogic - UserName/Password)
listusers
weblogic

Step 9. Set Up A Mail Client ( Can be Mozilla Thunderbird)


Download Mozilla Thunderbird From this link Or Select from latest releases here


Install Mozilla Thunderbird and Configure the POP3 Settings for weblogic user just we've created


Step 9. Time to Test the experiment - Stop the Admin Server in ProdDomain


Step 10. While Starting The WebLogic Admin Server you will see in the below log in console.


tusWatch' with severity 'Notice' on server 'AdminServer' has triggered at Jul 24
, 2010 8:40:07 PM IST. Notification details:
WatchRuleType: Log
WatchRule: (MSGID = 'BEA-000360')
WatchData: DATE = Jul 24, 2010 8:40:07 PM IST SERVER = AdminServer MESSAGE = Ser
ver started in RUNNING mode SUBSYSTEM = WebLogicServer USERID = SEV
ERITY = Notice THREAD = Main Thread MSGID = BEA-000360 MACHINE = shdyade TXID =
 CONTEXTID =  TIMESTAMP = 1279984207391
WatchAlarmType: None
WatchAlarmResetPeriod: 60000
>

Step 11. Check The Mail


This is it...  :)


Please let me know if any questions/suggestions, mail me for feedback on this


Thursday, July 8, 2010

Managing Semaphores Limits in Unix

Hello Guys,

We might have seen semaphores, siteminder (LLAWP) process issues while working on apache webserver, some time we will end up in restarting the server number of times but the application wont be working properly, while troubleshooting this issue, if you find out that we are having overloading semaphores and LLAWP process is behaving weird. And as a next process if you wish to clear out the semaphores, you may end up clearing out the semaphores of other webserver instance if any existing on the machine. If none you can safely clear the semaphores with the help of following commands

Give the details of existing semaphores
$ipcs –s

To remove the semaphores pass the semaphore id as an option to following command

$ipcrm

There is one more thing you need to look into if this doesn't work or help is the limit your operating system enforce on creation of semaphores and shared memory segments.

To view the limits of these semaphores creating we have file called sem in the operating system kernal path as below.

#cat /proc/sys/kernel/sem
    250 512000 32 1024

These numbers shows :

SEMMSL - The maximum number of semaphores in a sempahore set
SEMMNS - The maximum number of sempahores in the system
SEMOPM - The maximum number of operations in a single semop call
SEMMNI - The maximum number of sempahore sets

This may happen that because of these limitations we are unable get the semaphores created for the server and the site requests are not serving properly.

so if you would like to increase the values, there may be 2 ways for this.

1. You can directly echo the values to the file.

#echo >/proc/sys/kernel/semmsl

2. Edit the Kernal parameters with sysctl command

#sysctl -w "kernel.sem=250 512000 32 1024"

Verify this with

#cat /proc/sys/kernel/sem


or

#sysctl -A
#grep kernel.sem

Any Comments ?

Thanks
Shailesh Dyade